Updated June 2020
Informix SQL Capture Techniques: InformixHQ GUI available from IDS 12.10.FC13 and 14.10.FC1.
Abstract
Analysis of SQL statements going through a database engine can be the most important task to improve user response times. Even if you think all is well, you may discover coding faults or unexpected choices made by the query optimizer, resulting in longer execution times and higher system load, that can often be easily fixed once you know which are the worst. It isn’t just the longest queries that matter: saving a few milliseconds on a statement can have a big impact if it’s run thousands of times.
Increasingly, database security and auditing is becoming a focus. For example, there may be a requirement to identify which users have made schema changes or updated certain tables. Most auditing solutions focus on how specific data records have changed, however, sometimes it is more meaningful to know what SQL was actually run to generate that change.
Whatever the requirement, in order to analyse SQL workload, we need to capture SQL statements.
Over recent years, a number of commercial solutions have entered the market that are designed to provide a SQL capture capability. We’ve evaluated most of these products including: iWatch (Exact Solutions); SQL Power (SQL Power Tools). An analysis of these tools is outside the scope of this particular article.
This article will focus on what can be achieved with the underlying Informix software utilities (including Informix SQL/SPL scripting approaches) and various Informix management interfaces and tools.
Content
Although there is an array of SQL and session analysis options available with the Informix onstat utility, these are very well documented and not considered in this article. The key sampling techniques that we will explore in this article are:
- completed SQL statements using SQLTRACE
- prepared SQL statements using sysmaster:sysconblock
Sampling with SQLTRACE
Within Informix, the SQLTRACE configuration parameter controls the number of SQL statement completions that should be presented in rolling pseudo-table sysmaster:syssqltrace and the level of detail held for each:
In the above example, the highest level of detail will be available for the last 10K completed statement executions, with 4KB allocated to each (longer statements will be truncated), and for all user names (“global”). The possible values for “level” are:
Off – no SQL tracing
Low – captures statement statistics/text/iterators
Medium – as above plus table/database names & procedure stacks
High – as above plus variable values
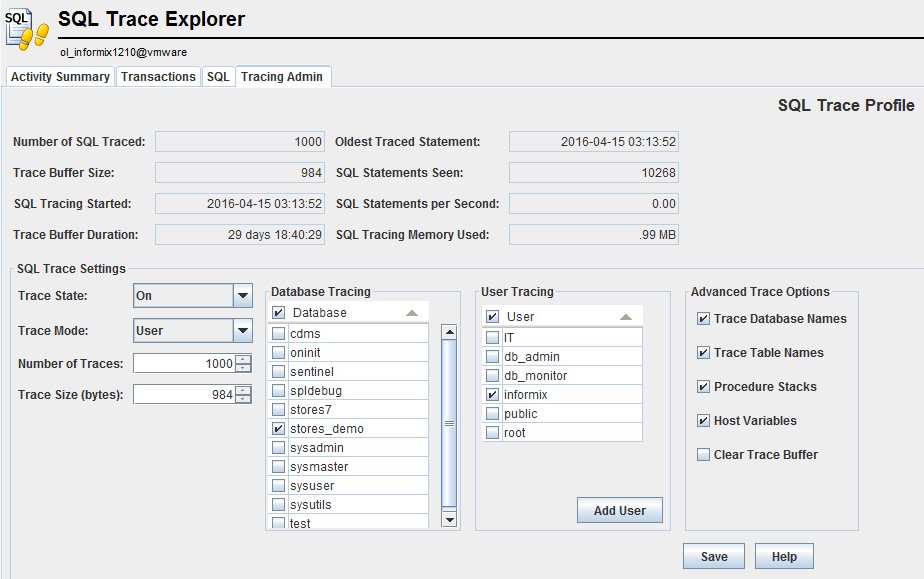
The shared memory required in this example is simply 10K x 4KB, i.e. 10MB: see “sqlhistory” memory pool in onstat -g mem output, and CPU overhead is modest. Settings can be reviewed by looking at the first few lines of onstat -g his output. The parameter can be changed dynamically using the onmode -wf command or “set sql” options of the sysadmin:task Admin API function for greater control. Better still, GUIs are provided to configure and view tracing results by:
- Open Admin Tool (OAT) – included with IDS and/or the corresponding free Client SDK download up to version 12.10.xC9.
- InformixHQ – included with IDS 12.10.FC13 or 14.10.FC1 onwards and supersedes OAT.
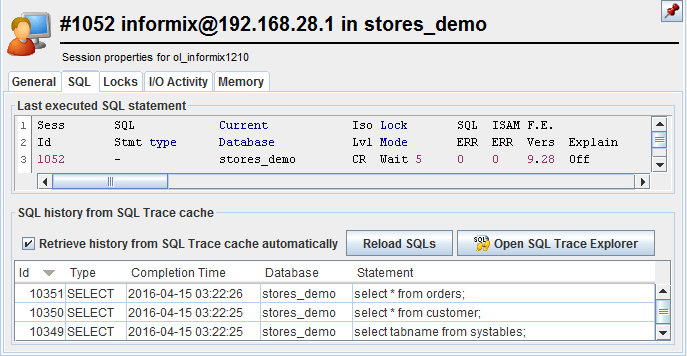
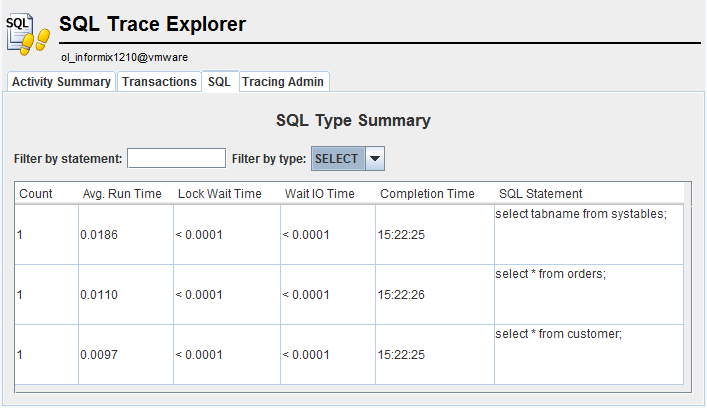
- AGS Server Studio – integrated with execution plan analysis, see screenshots below.
SQLTRACE Configuration
Session SQLTRACE drill-down
All sessions SQLTRACE listing
Sampling with sysmaster:sysconblock
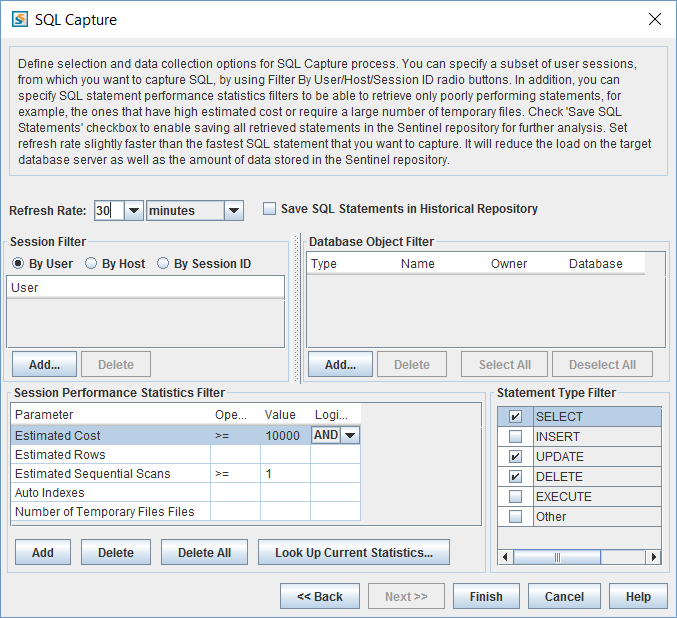
Another approach that can be used to identify the most expensive SQL operations is to analyse prepared statements currently registered with the database engine in the sysmaster:sysconblock table. This contains estimated costs as would be shown in a query plan produced by SET EXPLAIN ON rather than actual run time as with SQLTRACE. Well-constructed applications prepare SQL once on start-up and maintain persistent database connections, so statements that are potentially the heaviest should be continuously visible here. Note that this approach is supported on IDS 10 or earlier, whereas SQLTRACE is only available from IDS 11 onwards. Prepared SQL capture can be achieved either with the Oninit script – which extracts both from this and the SQLTRACE buffer – or AGS Sentinel as shown in our video demo and screenshots below:
Sentinel SQL Capture definition
Sentinel SQL Capture results
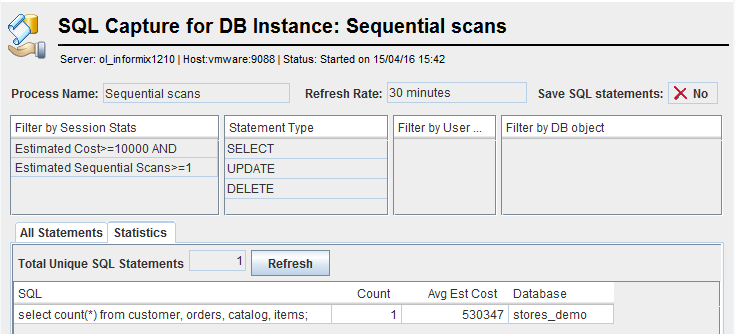
In the above example, only statements with an estimated cost over 10000 involving a sequential scan are captured, and only certain types particularly as INSERT statements often have a spurious estimated cost.
It is of course possible to identify which tables have the highest activity metrics – counts of locks, ISAM operations, page/buffer I/O, sequential scans – from the sysmaster:sysptprof view. For example, this SQL shows tables with the most lock waits:
Alternatively, use the AGS Server Studio “Tables I/O Activity” report. Figures are since Informix was restarted or the database server statistics were cleared with onstat -z. This can sometimes be enough information for developers to find the problem code.
Conclusion
There are many Informix SQL capture techniques and tools for performance tuning or auditing purposes. The best solution will depend on the requirements, but there will be an appropriate tool for your system. Poorly performing statements can be identified so that improvements can be made by creating indexes, adding optimizer directives or fixing SQL code.
Disclaimer
Suggestions above are provided “as is” without warranty of any kind, either express or implied, including without limitation any implied warranties of condition, uninterrupted use, merchantability, fitness for a particular purpose, or non-infringement.

